Overview
A general introduction video that provides a high-level overview of the pipeline.
You can view an example of how MCMICRO turns image tiles into single-cell segmented mosaic images here: MCMICRO Pipeline Visual Guide
MCMICRO for processing and analyzing images
Processing and analyzing multiplexed images – which can encompass massive amounts of data – is a computationally intensive task. For instance, to image a full pathology slide, the sample area is divided into a grid of tiles – between 102 to 103 per slide – where each tile is a multidimensional TIFF. When combined with multiplexed imaging methods, this results in biologically rich image sets that encompass many sample positions and many proteins. The resulting data set is massive – up to 50,000 x 50,000 pixels x 100 channels per tile or ~500 GB of data per slide – too large to be handled with conventional image processing methods.
MCMICRO provides customizable software that processes whole slide microscopy data into cohesive images that can be easily visualized and quantified as single cell data.
Click on the image below to learn more:
The MCMICRO modules:
Image tiles to whole-slide mosaic images
Before performing analysis, the image tiles must be combined into a single mosaic image where all tiles and channels can be viewed simultaneously. We do this with i) illumination correction through BaSIC, ii) alignment and stitching by ASHLAR, and iii) image quality control using human-in-the-loop methods.
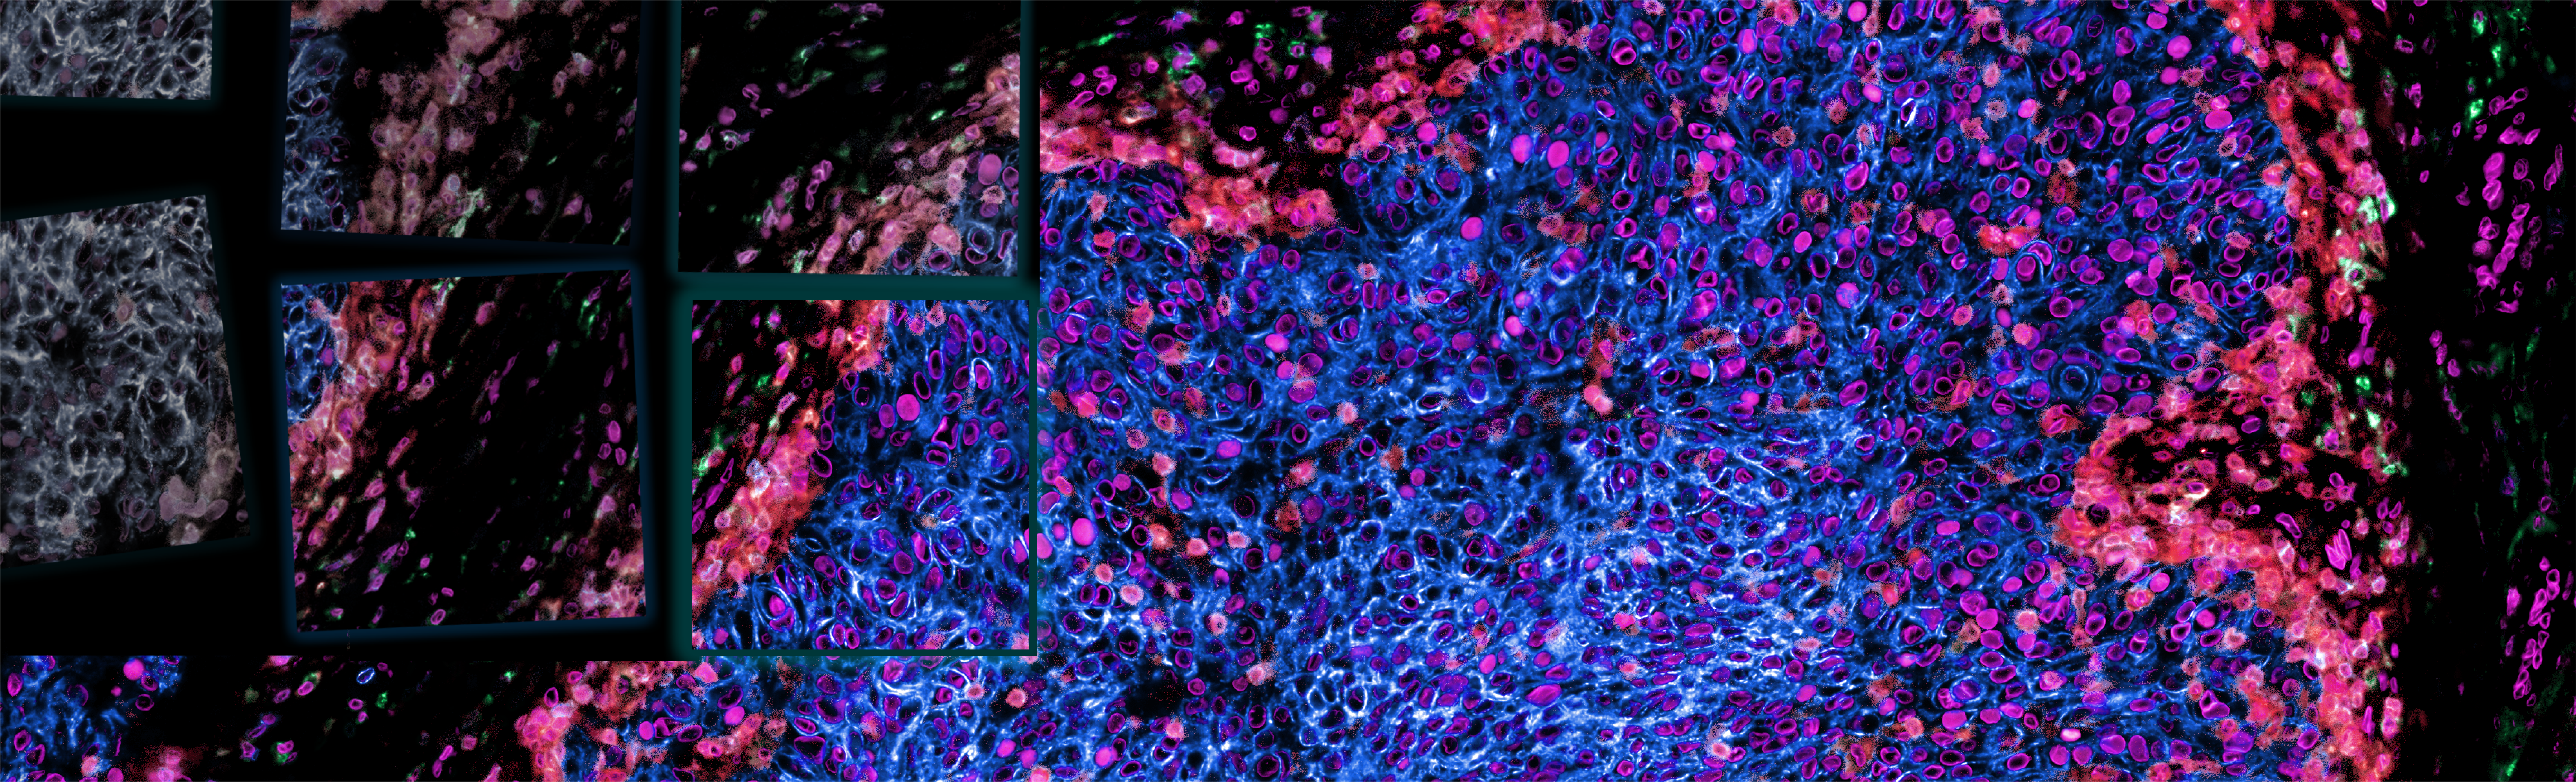 From raw image (left) to illumination corrected tiles using BaSiC (center left) to a stitched mosaic image with ASHLAR (right). Credit: C. Yapp
Illumination Correction
BaSiC
Collecting multiplexed images is time consuming – imaging multiple whole slide samples can sometimes span several days. Microscope illumination is rarely perfectly stable over these long periods of time, so individual tile illumination is not entirely uniform. We correct for these issues with a process known as flat fielding using the BaSiC (Peng et al., 2017) software package (developed elsewhere).
Stitching and registration
ASHLAR
The tiles must then be combined into a seamlessly aligned mosaic image in a process known as stitching. We developed the ASHLAR software package to generate highly accurate mosaic images for whole-slide imaging (Muhlich et al., 2021). Visit the ASHLAR website to learn more about how ASHLAR works and how to implement ASHLAR.
TMA core detection (optional)
Coreograph
Coreograph identifies complete and partial tissue cores on a tissue microarray and exports these tissue cores as individual images for faster downstream image processing (Schapiro et al., 2021). Coreograph uses a deep learning model, UNet (Ronneberger et al., 2015).
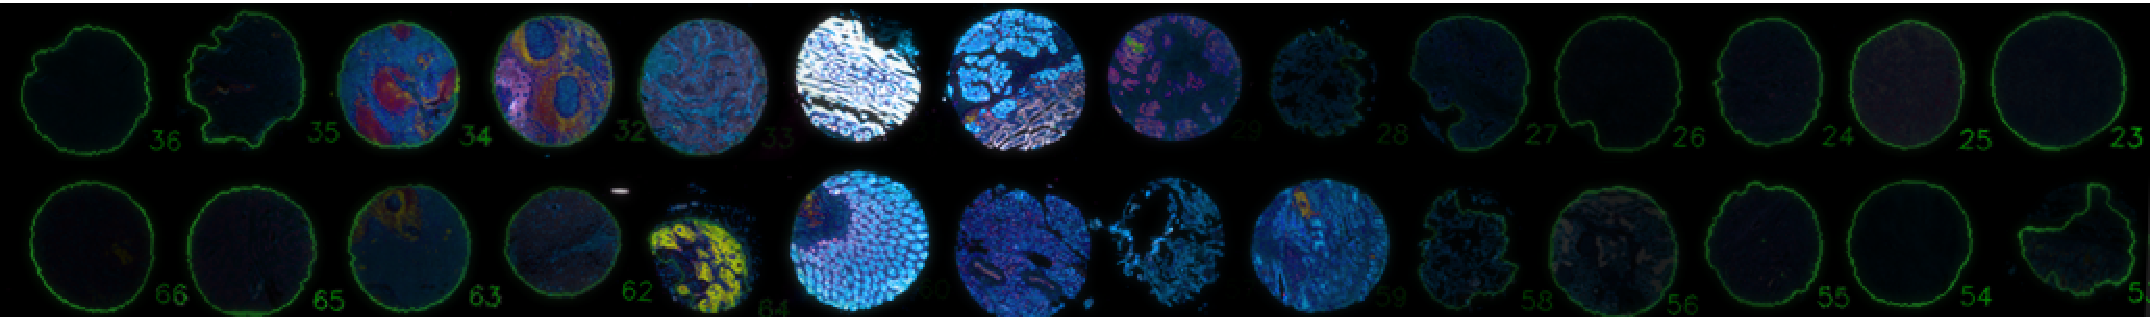 A TMA array showing tissue cores (center) that have been processed with Coreograph to generate individual core masks (green outlines, left and right). Credit: C. Yapp
Mosaic images to single-cell data
Extracting single-cell level data from highly multiplexed image data allows for clinically useful biological data at a depth that was not previously possible. To do this, images must first be segmented into single cells, then important properties can be extracted on a per-cell or per-organelle basis into a descriptive cell features table.
Segmentation
There are many solutions for segmentation that can be used with MCMICRO. We describe two, UnMICST (Yapp et al., 2021), a method that generates pixel probability maps, and S3segmenter (Saka et al., 2019), a watershed method for generating segmentation masks.
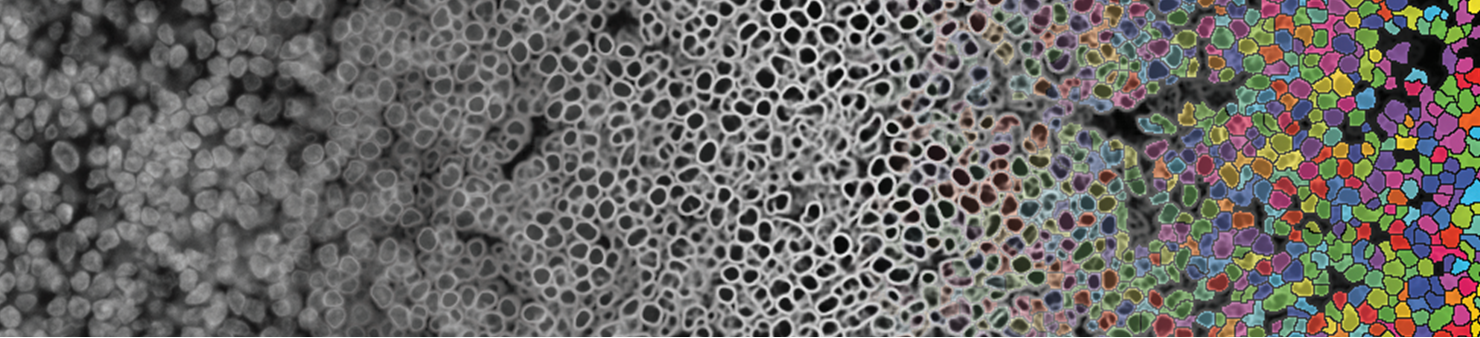 Segmentation - from raw image (left) to preprocessing using UnMICST (center) to single cells (right). Credit: C. Yapp
UnMICST
UnMICST is one example of a semantic segmentation method that generates pixel-level probability maps. These probability maps use pixel intensity to indicate how confidently that pixel has been classified as either the nucleus or background of the image (Yapp et al., 2021). Visit the UnMICST website to learn more!
S3segmenter
S3segmenter provides one example of a marker-controlled watershed approach to segmentation. S3segmenter takes in segmentation probability maps and uses them to generate single-cell (nuclei and cytoplasm) masks. S3segmenter is quite versatile - it is compatible with both semantic and instance based segmentation methods and can also be applied for robust spot detection (i.e. RNAscope or FISH) within samples.
Quantification
MCQuant
MCQuant takes in a multichannel image and segmentation masks and extracts single-cell data. For each mask, this generates a Cell Feature Table that records the positions of individual cells and the associated features such as marker intensity, morphology, and quality control attributes. The Cell Feature Table is used for all subsequent analysis and is compatible with many tools developed for visualization of single cell sequencing data, like cellxgene (Megill et al., 2021).
Note: A single marker can be processed to generate a large number of distinct descriptive features beyond marker intensity (e.g. shape, granularity, localization within the cell, etc.).
Quality control
All tissue images contain technical artifacts that can disrupt image analysis. These can include sectioning artifacts (areas where the knife compresses or tears the specimen), embedded foreign objects (dust, hair), or regions of fat or necrotic tissue that cannot be easily analyzed. Humans are remarkably good at looking past these artifacts to identify biologically meaningful patterns in biological data, but artifacts complicate computational methods of single-cell data analysis.
CyLinter
CyLinter is a human-in-the-loop interactive quality control software for identifying and removing cells corrupted by microscopy artifacts in multiplexed tissue images. The program takes single-cell feature tables generated by the MCMICRO image processing pipeline as input and returns a set of de-noised feature tables for use in downstream analyses.
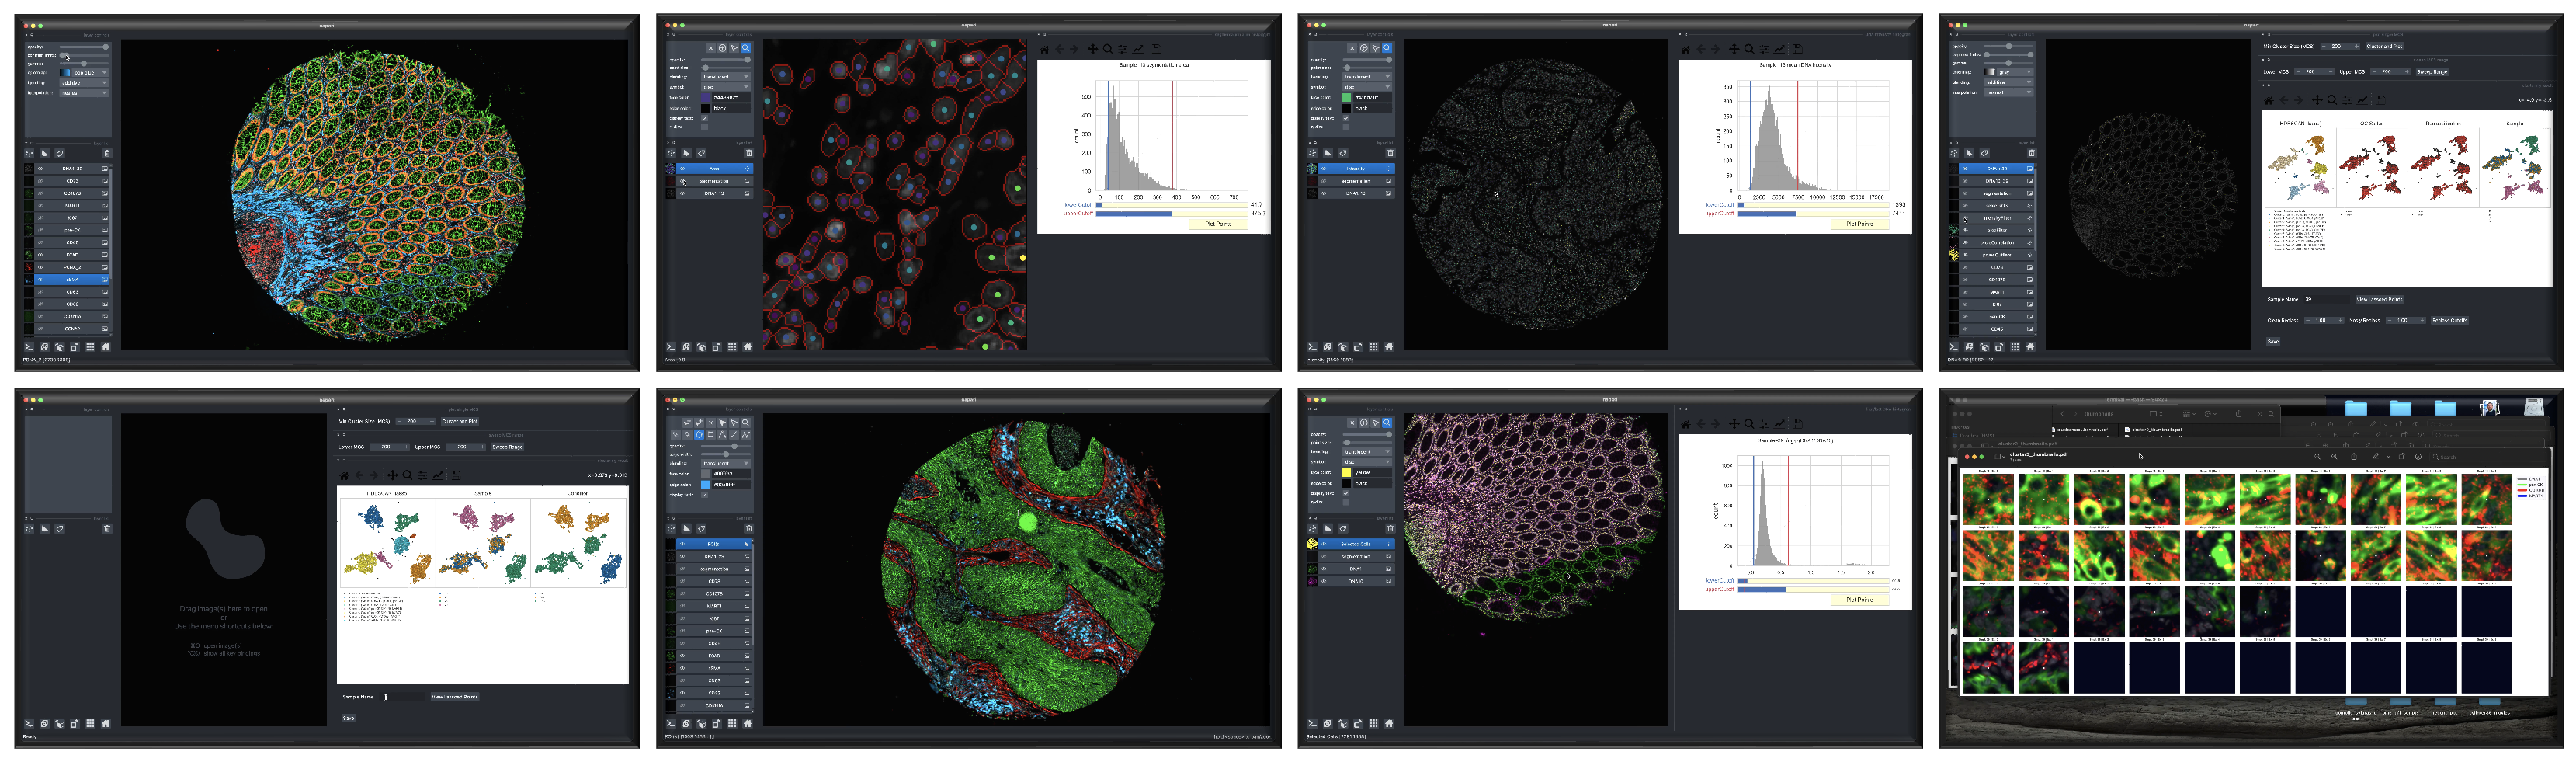 Screenshots depicting different phases of the CyLinter workflow.
Analysis
SCIMAP
SCIMAP is a scalable toolkit for analyzing spatial molecular data. SCIMAP takes in spatial data mapped to X-Y coordinates and supports preprocessing, phenotyping, visualization, clustering, spatial analysis, and differential spatial testing (Nirmal et al., 2022).
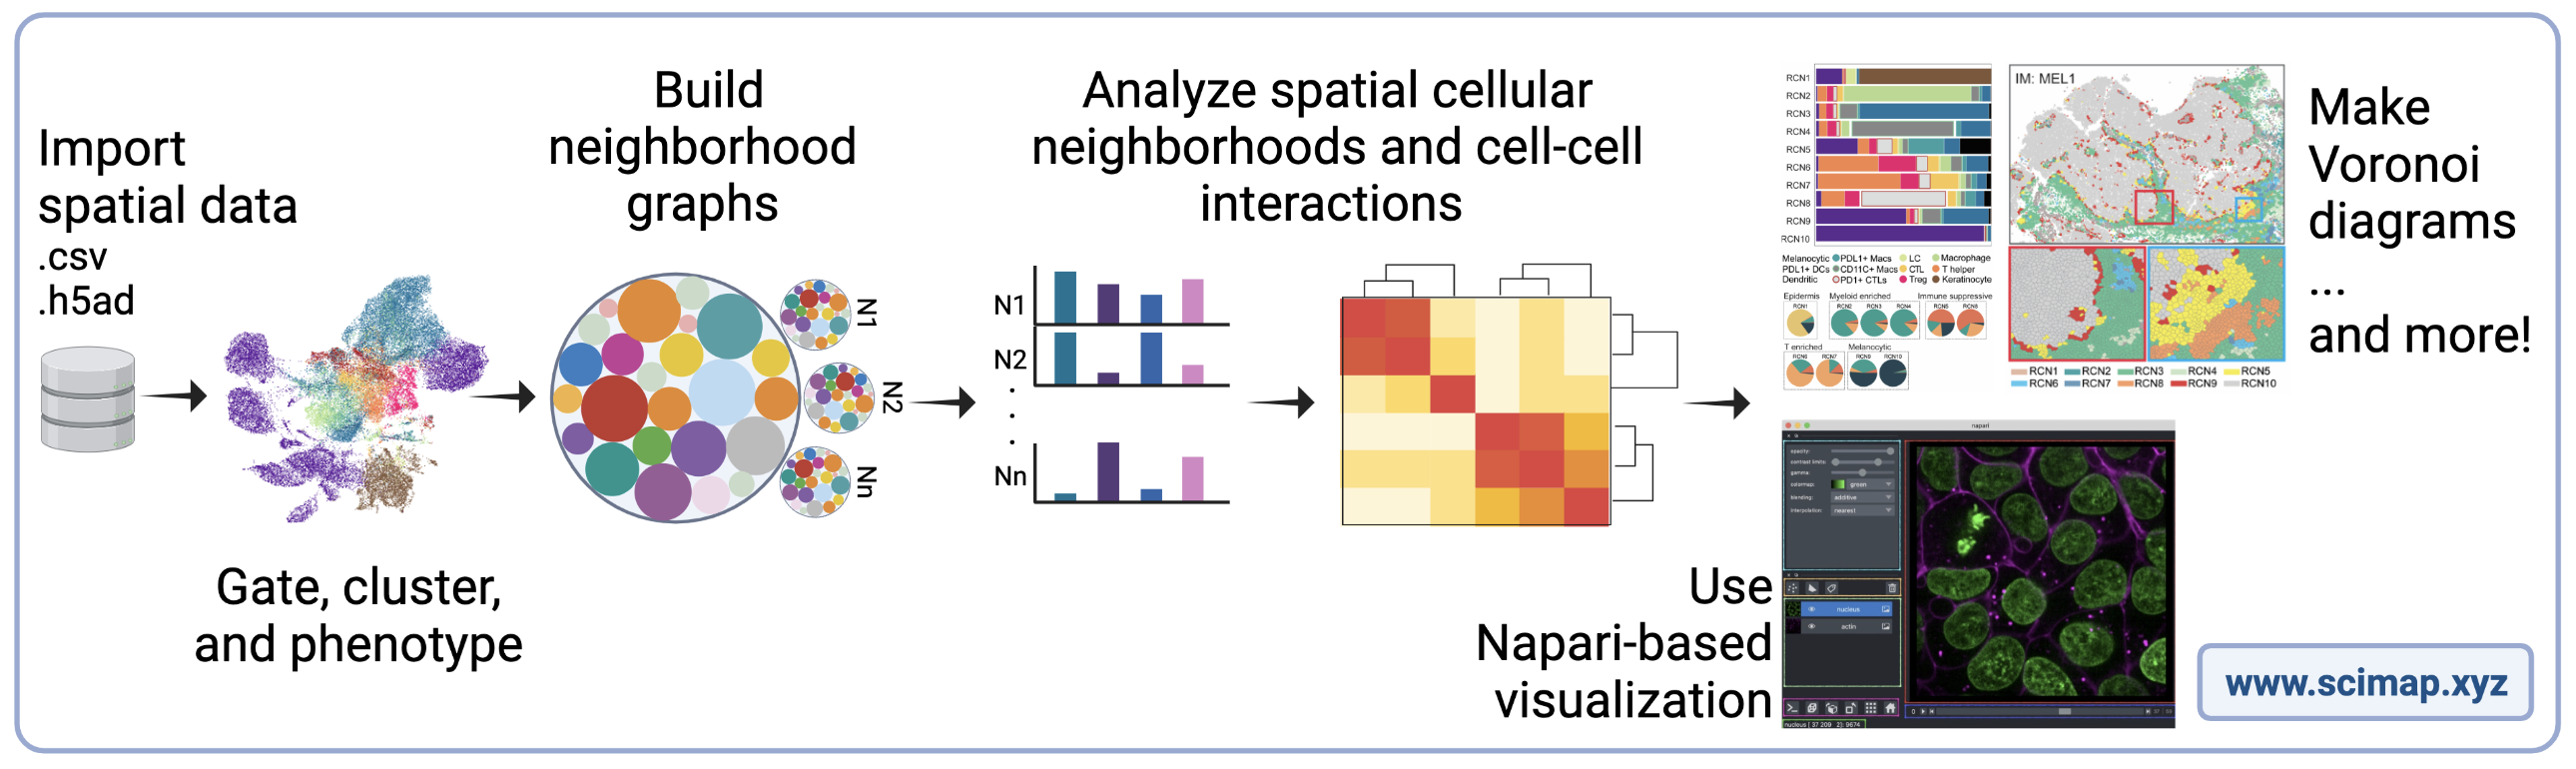 An overview of the SCIMAP toolkit.
Visualization
Minerva
Minerva is a suite of software tools that enables interactive viewing and sharing of large image data (Rashid et al., 2021; Hoffer et al., 2020). Currently, we have released Minerva Author, a tool that lets you easily annotate images and create narrative guides to walk through the data, and Minerva Story, the image viewer that hosts the stories online. MCMICRO now has an option to automatically create non-narrated “auto-Minerva” stories as part of the pipeline. Additional tools are in active development - go to the Minerva wiki for the most up-to-date information about the Minerva suite.
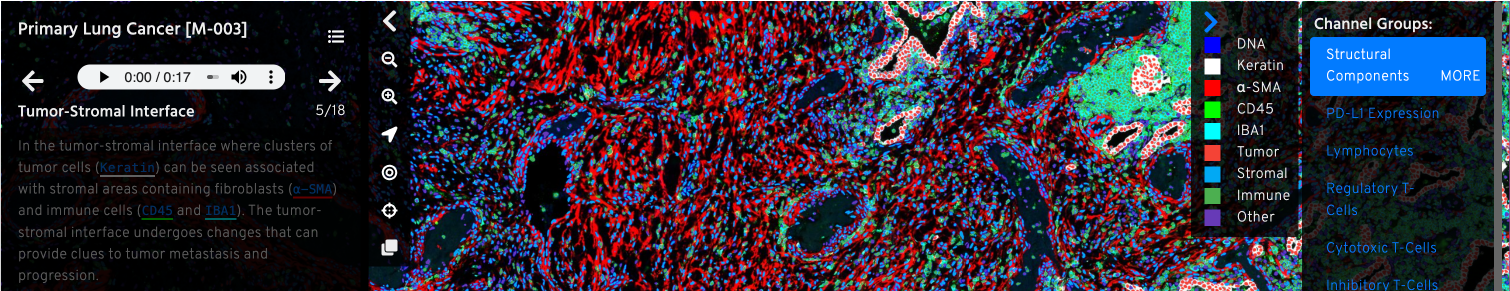 A screenshot from a Minerva story on primary lung cancer - view the story here.
Walk through the process of turning image tiles into single-cell segmented mosaic image:
MCMICRO Pipeline Visual Guide
**Missing something?? – Suggest a module for us to develop in the future!**
Example datasets for method development
We release The Exemplar Microscopy Images of Tissues dataset (EMIT) to enable the development additional modules for MCMICRO. Presently, the dataset consists of one TMA and one set of whole-slide images, acquired using multiple imaging platforms. The dataset provides real-world scenarios for testing of image processing methods, and we expect to expand the dataset with additional images in the future.
The open microscopy environment (OME)
MCMICRO is designed to solve the problem of processing high volumes of tissue image data and yield reliable image mosaics and single cell data. It does not, however, solve all problems associated with the analysis and publication of images. We strongly recommend that laboratories also adopt the database and visualization tools provided by the OME community. The OME community is welcoming and has many online resources that discuss the topics described above; OME sponsors multiple workshops and conferences of interest to new and experienced microscopists.