Module Options
Parameters under the namespace options regulate the function of individual modules in the pipeline. Parameters are matched to the appropriate module using the name: fields in the namespace modules.
Click on the different modules to learn more.
Core modules:
All modules in MCMICRO are available as standalone executable Docker containers. When running modules within MCMICRO, the inputs and outputs will be handled by the pipeline and do not need to be specified explicitly.
BaSiC
Illumination correction
Description
The module implements the BaSiC method for correcting uneven illumination, developed externally by (Peng et al., 2017). The module doesn’t have any additional parameters.
Usage
By default, MCMICRO skips this step as it requires manual inspection of the outputs to ensure that illumination correction does not introduce artifacts for downstream processing. Add start-at: illumination to workflow parameters to request that MCMICRO runs the module.
- Example
params.yml:
workflow:
  start-at: illumination
  illumination: true
- Running outside of MCMICRO: Instructions.
Input
Unstitched images in any BioFormats-compatible format. Nextflow will take these from the raw/ subdirectory within the project.
Output
Dark-field and flat-field profiles for each unstitched image. Nextflow will write these to the illumination/ subdirectory within the project.
ASHLAR
Stitching and registration
Description
The module performs simultaneous stiching of tiles and registration across channels. Check the ASHLAR website for the most up-to-date documentation.
Usage
MCMICRO runs ASHLAR by default. Add ashlar: to options to control its behavior.
- Example
params.yml:
options:
  ashlar: --flip-y -c 5
- Default:
ashlar: -m 30 - Running outside of MCMICRO: ASHLAR website.
Input
- Unstitched images in any BioFormats-compatible format. Nextflow will take these from the
raw/subdirectory within the project. - [Optional] Dark-field and flat-field profiles from illumination correction. Nextflow will take these from the
illumination/subdirectory within the project.
Output
A pyramidal, tiled .ome.tif. Nextflow will write the output file to registration/ within the project directory.
Optional parameters for ASHLAR
| Name; Shorthand | Description | Default |
|---|---|---|
--align-channel CHANNEL; -c CHANNEL | Align images using channel number CHANNEL | Numbering starts at 0 |
--flip-x | Flip tile positions left-to-right to account for unusual microscope configurations | |
--flip-y | Flip tile positions top-to-bottom to account for unusual microscope configurations | |
--flip-mosaic-x | Flip mosaic image horizontally | |
--flip-mosaic-y | Flip mosaic image vertically | |
--output-channels CHANNEL [CHANNEL...] | Output only channels listed in CHANNELS | Numbering starts at 0 |
--maximum-shift SHIFT; -m SHIFT | Maximum allowed per-tile corrective shift in microns | |
--filter-sigma SIGMA | Width in pixels of Gaussian filter to apply to images before alignment | Default is 0 (which disables filtering) |
--filename-format FORMAT; -f FORMAT | Use FORMAT to generate output filenames, with {cycle} and {channel} as required placeholders for the cycle and channel numbers | default is cycle_{cycle}_channel_{channel}.tif |
--pyramid | Write output as a single pyramidal TIFF | |
--tile-size PIXELS | Set tile width and height to PIXELS (pyramid output only) | Default is 1024 |
--plates | Enable mode for multi-well plates (for high-throughput screening assays) |
Troubleshooting
Visit the ASHLAR website for troubleshooting tips.
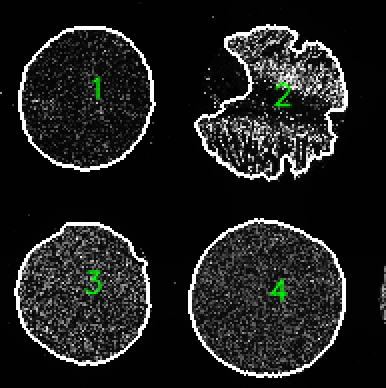
Coreograph
TMA core detection and dearraying
Description
The modules uses the popular UNet deep learning architecture to identify cores within a tissue microarray (TMA). After identifying the cores, it extracts each one into a separate image to enable parallel downstream processing of all cores.
Usage
By default, MCMICRO assumes that the input is a whole-slide image. Add tma: true to workflow to indicate that the input is a TMA instead. Add coreograph: to options to control the module behavior.
- Example
params.yml:
workflow:
  tma: true
options:
  coreograph: --channel 3
- Running outside of MCMICRO: Instructions.
Input
A fluorescence image of a tissue microarray where at least one channel is of DNA (such as Hoechst or DAPI). Nextflow will take this from the registration/ subfolder within the project.
Output*
- Individual cores as
.tifstacks with user-selectable channel ranges - Binary tissue masks (saved in the ‘mask’ subfolder)
- A TMA map showing the labels and outlines of each core for quality control purposes
- A text file listing the centroids of each core in the format: Y, X
* Nextflow will write images and masks to the dearray/ subfolder and the TMA map to the qc/coreo/ subfolder within the project.
Optional arguments to Coreograph
| Parameter | Default | Description |
|---|---|---|
--downsampleFactor | Default is 5 times to match the training data | How many times to downsample the raw image file |
--channel | Which channel is fed into UNet to generate probability maps (usually DAPI) | |
--buffer | 2 | The extra space around a core before cropping it. A value of 2 means there is twice the width of the core added as buffer around it. |
--outputChan | a range of channels to be exported. -1 is default and will export all channels (takes awhile). Select a single channel or a continuous range. --outputChan 0 10 will export channel 0 up to and including channel 10 | |
--tissue | Coreograph will assume that its input is a whole-slide image and will work to isolate individual tissue chunks into separate files |
Troubleshooting
A troubleshooting guide can be found within Coreograph parameter tuning.
UnMICST
Image segmentation - probability map generation
Description
UnMICST uses a convolutional neural network to annotate each pixel with the probability that it belongs to a given subcellular component (nucleus, cytoplasm, cell boundary). Check the UnMICST website for the most up-to-date documentation.
Usage
MCMICRO applies UnMicst to all input images by default. Add unmicst: to options to control its behavior.
- Example
params.yml:
options:
  unmicst: --scalingFactor 0.5
- Running outside of MCMICRO: Instructions.
Input
An .ome.tif, preferably flat field corrected. The model is trained on images acquired at a pixelsize of 0.65 microns/px. If your settings differ, you can upsample/downsample to some extent. Nextflow will use as input files from the registration/ subdirectory for whole-slide images and from the dearray/ subdirectory for tissue microarrays.
Output *
- a
.tifstack where the different probability maps for each class are concatenated in the Z-axis in the order: nuclei foreground, nuclei contours, and background. - a QC image with the DNA image concatenated with the nuclei contour probability map with suffix Preview
* Nextflow will write probability maps to the probability-maps/unmicst/ subfolder and the previews to the qc/unmicst/ subfolder within the project.
Optional arguments to UnMicst
| Parameter | Default | Description |
|---|---|---|
--tool <version> | unmicst-solo | UnMicst version: unmicst-legacy is the old single channel model. unmicst-solo uses DAPI. unmicst-duo uses DAPI and lamin. |
--model | human nuclei from DAPI | The name of the UNet model. By default, this is the human nuclei model that identifies nuclei centers, nuclei contours, and background from a DAPI channel. Other models include mouse nuclei from DAPI, and cytoplasm from stains resembling WGA |
--channel <number> | 1 | The channel used to infer and generate probability maps from. If using UnMicst2, then specify 2 channels. If only 1 channel is specified, it will simply be duplicated. NOTE: If not using default value, the 1st channel must be specified to S3segmenter as –probMapChan in –s3seg-opts |
--classOrder | None | If your training data isn’t in the order 1. background, 2. contours, 3. foreground, you can specify the order here. For example, if you had trained the class order backwards, specify --classOrder 3 2 1. If you only have background and contours, use --classOrder 1 2 1. |
--mean <value> | Extracted from the model | Override the trained model’s mean intensity. Useful if your images are significantly dimmer or brighter. |
--std <value> | Extracted from the model | Override the trained model’s standard deviation intensity. Useful if your images are significantly dimmer or brighter. |
--scalingFactor <value> | 1 | An upsample or downsample factor used to resize the image. Useful when the pixel sizes of your image differ from the model (ie. 0.65 microns/pixel for human nuclei model) |
--stackOutput | Specified | If selected, UnMicst will write all probability maps as a single multipage tiff file. Otherwise, UnMicst will write each class as a separate file. |
--GPU <index> | Automatic | Explicitly specify which GPU (1-based indexing) you want to use. Useful for running on local workstations with multiple GPUs. |
Troubleshooting
A troubleshooting guide can be found within UnMICST parameter tuning - additional information is also available on the UnMICST website .
S3segmenter
Image segmentation - cell mask generation
Description
The modules applies standard watershed segmentation to probability maps to produce the final cell/nucleus/cytoplasm/etc. masks.
Usage
By default, MCMICRO applies S3segmenter to the output of all modules that produce probability maps. Add s3seg: to options to control its behavior..
- Example
params.yml:
options:
  s3seg: --logSigma 2 10
Inputs
- A fully-stitched and registered
.ome.tif, preferably flat field corrected. Nextflow will take these from theregistration/anddearray/subdirectories, as approrpriate. - A 3-class probability map, as derived by modules such as UnMICST or Ilastik.
S3segmenter assumes that you have:
- Acquired images of your sample with optimal acquisition settings.
- Stitched and registered the tiles and channels respectively (if working with a large piece of tissue) and saved it as a Bioformats compatible tiff file.
- Processed your image in some way so as to increase contrast between individual nuclei using classical or machine learning methods such as Ilastik (a random forest model) or UnMICST (a deep learning semantic segmentation model based on the UNet architecture). MCMICRO supports both.
Output
1) 32-bit label masks for each compartment of the cell:
nuclei.ome.tif(nuclei)cytoplasm.ome.tif(cytoplasm)cell.ome.tif(whole cell)- If only nuclei segmentation was carried out,
cell.ome.tifis identical tonuclei.ome.tif
Nextflow saves these files to the segmentation/ subfolder within your project.
2) Two-channel quality control files with outlines overlaid on gray scale image of channel used for segmentation
nucleiOutlines.tif(nuclei),cytoplasmOutlines.tif(cytoplasm)cellOutlines.tif(whole cell)- If only nuclei segmentation was carried out,
cellOutlines.tifis identical tonucleiOutilnes.tif
Nextflow saves these files to the qc/s3seg/ subfolder within your project.
NOTE: There are at least 2 ways to segment cytoplasm: i) using a watershed approach or ii) taking an annulus/ring around nuclei. Files generated using the annulus/ring method will have ‘Ring’ in the filename whereas files generated using watershed segmentation will not. It is important that these two groups of files are NOT combined and analyzed simultaneously as cell IDs will be different between them.
Optional arguments to S3Segmenter
| Parameter | Default | Description |
|---|---|---|
--probMapChan <index> | 1 | which channel is used for nuclei segmentation. Coincides with the channel used in upstream semantic segmentation modules. Must specify when different from default. |
--crop <selection> | noCrop | Type of cropping: interactiveCrop - a window will appear for user input to crop a smaller region of the image; plate - this is for small fields of view such as from a multiwell plate; noCrop, the default, is to use the entire image |
Nuclei parameters:
| Parameter | Default | Description |
|---|---|---|
--nucleiFilter <selection> | IntPM | Method to filter false positive nuclei: IntPM - filter based on probability intensity; Int - filted based on raw image intensity |
--logSigma <value> <value> | 3 60 | A range of nuclei diameters to search for. |
Cytoplasm parameters:
| Parameter | Default | Description |
|---|---|---|
--segmentCytoplasm <selection> | ignoreCytoplasm | Select whether to segmentCytoplasm or ignoreCytoplasm |
--CytoMaskChan <index> | 2 | One or more channels to use for segmenting cytoplasm, specified as 1-based indices (e.g., 2 is the 2nd channel). |
--cytoMethod <selection> | distanceTransform | The method to segment cytoplasm: distanceTransform - take the distance transform outwards from each nucleus and mask with the tissue mask; ring - take an annulus of a certain pixel size around the nucleus (see cytoDilation); hybrid - uses a combination of greyscale intensity and distance transform to more accurately approximate the extent of the cytoplasm. Similar to Cellprofiler’s implementation. |
--cytoDilation <value> | 5 | The number of pixels to expand from the nucleus to get the cytoplasm ring. |
--TissueMaskChan <index> | Union of probMapChan and CytoMaskChan | One or more channels to use for identifying the general tissue area for masking purposes. |
Troubleshooting
A troubleshooting guide can be found within S3segmenter parameter tuning.
MCQuant
Single-cell data quantification
Description
The modules uses one or more segmentation masks against the original image to quantify the expression of every channel on a per-cell basis. Check the MCQuant README for the most up-to-date documentation.
Usage
By default, MCMICRO runs MCQuant on all cell segmentation masks that match the cell*.tif filename pattern. Add mcquant: to options to specify a different mask or to provide additional module-specific arguments to MCMICRO.
- Example
params.yml:
options:
  mcquant: --masks cytoMask.tif nucleiMask.tif
- Running outside of MCMICRO: Instructions.
Inputs
- A fully stitched and registered image in
.ome.tifformat. Nextflow will use images in theregistration/anddearray/subfolders as appropriate. - One or more segmentation masks in
.tifformat. Nextflow will use files in thesegmentation/subfolder within the project. - A
.csvfile containing amarker_namecolumn specifying names of individual channels. Nextflow will look for this file in the project directory.
Output
A cell-by-feature table mapping Cell IDs to marker expression and morphological features (including x,y coordinates).
Optional parameters for MCQuant
| Parameter | Description |
|---|---|
--mask_props | Space separated list of additional metrics to be calculated for every mask. This is intended for metrics that depend only on the cell mask. If the metric depends on signal intensity, use --intensity-props instead. See list at https://scikit-image.org/docs/dev/api/skimage.measure.html#regionprops. |
--intensity_props | Space separated list of additional metrics to be calculated for every marker separately. By default only mean intensity is calculated. If the metric doesn’t depend on signal intensity, use --mask-props instead. See list at https://scikit-image.org/docs/dev/api/skimage.measure.html#regionprops Additionally available is gini_index, which calculates a single number between 0 and 1, representing how unequal the signal is distributed in each region. See https://en.wikipedia.org/wiki/Gini_coefficient. For example, to calculate the median intensity, specify --intensity_props median_intensity. |
CyLinter
Quality control
Description
CyLinter is a human-in-the-loop quality control pipeline. It accepts as input the set of files generated by MCMICRO, including segmentation masks and single-cell feature tables, and returns a set of de-noised feature tables for use in downstream analyses.
Usage
Because it requires human interactivity, CyLinter is not executed by MCMICRO directly. Instead, users are encourage to follow steps outlined on the CyLinter website after applying MCMICRO to their data.
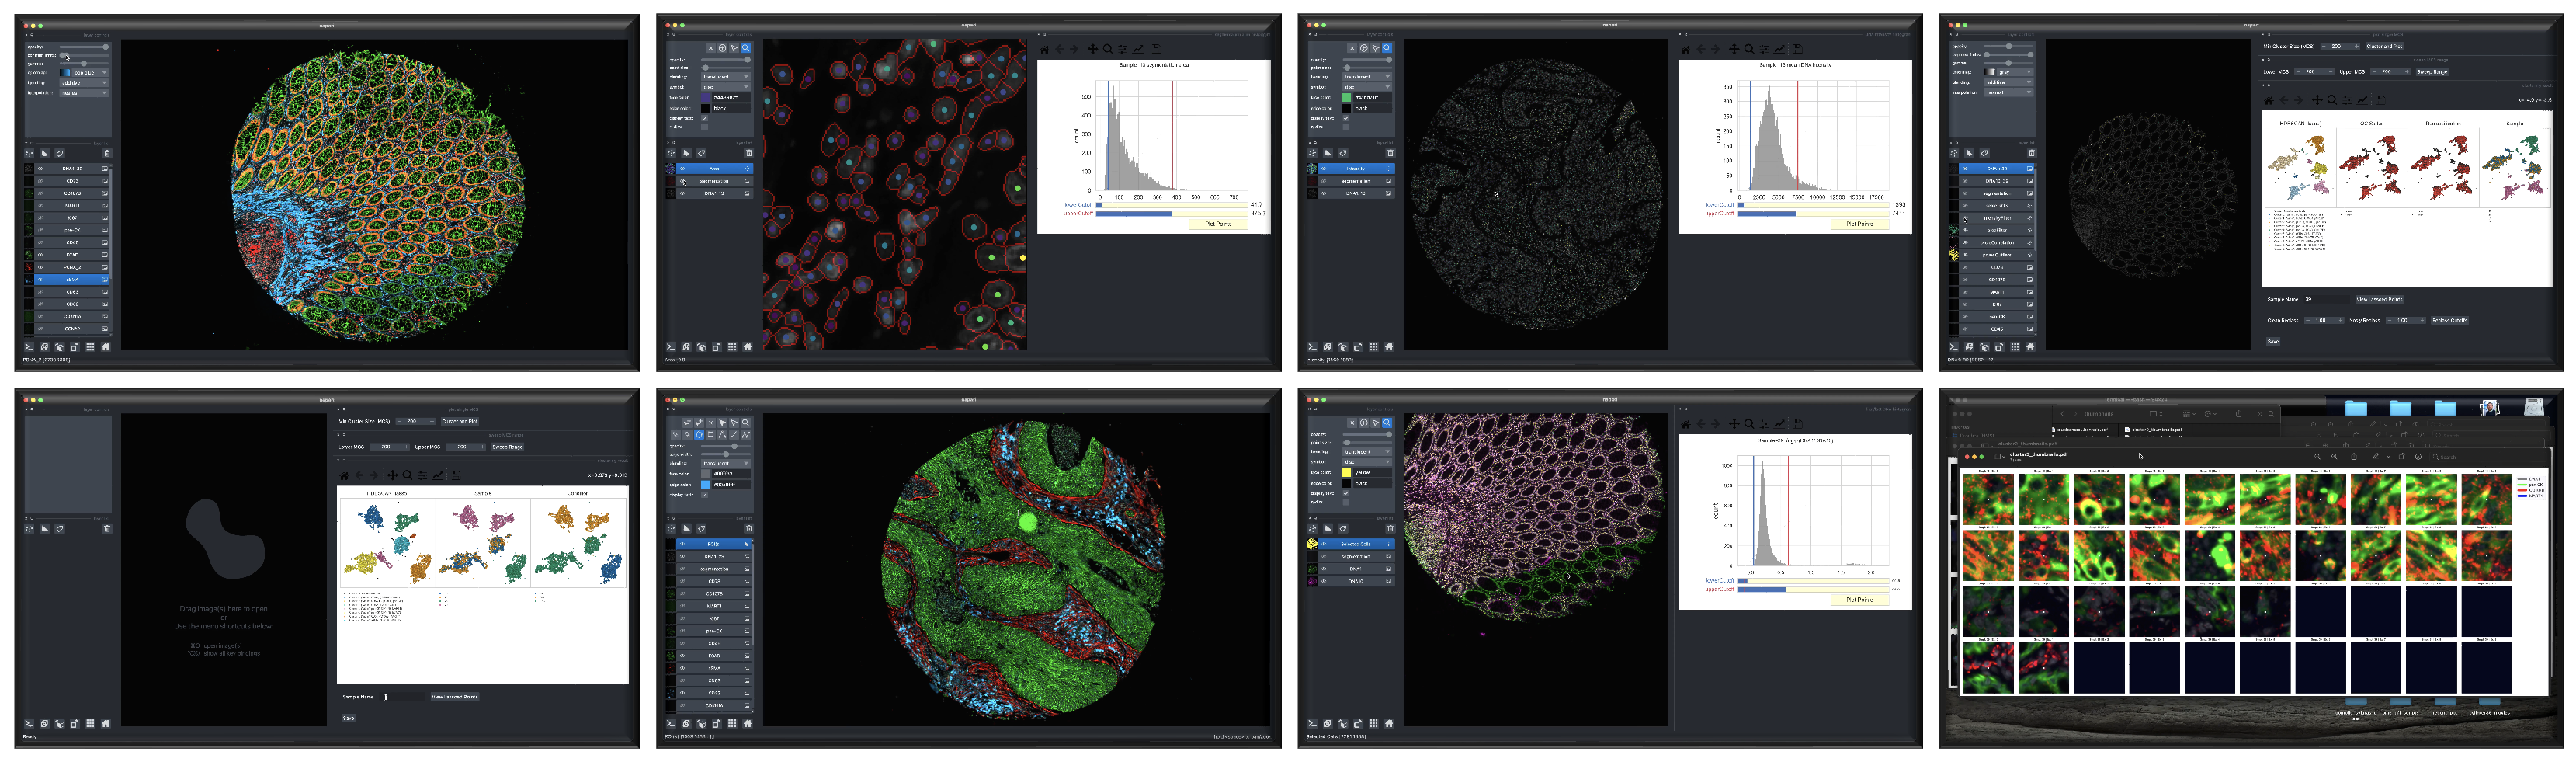 Screenshots depicting different phases of the CyLinter workflow.
SCIMAP
Spatial analysis
Description
SCIMAP is a suite of tools that enables spatial single-cell analyses. Check the SCIMAP website for the most up-to-date documentation.
Usage
MCMICRO allows users to automatically apply SCIMAP’s clustering algorithms to the cell-by-feature table produced by MCQuant. The clustering results can be subsequently used for manual assignment of cell states. Since MCMICRO stops at MCQuant by default, users will need to explicitly request that the pipeline continues to the clustering step. MCMICRO’s usage of SCIMAP doesn’t have any parameters, and users are encouraged to check the SCIMAP website for more sophisticated human-in-the-loop analyses.
Add downstream: scimap and stop-at: downstream to workflow parameters to enable SCIMAP. Add mcquant: to options to control its behavior.
- Example
params.yml:
workflow:
  stop-at: downstream
  downstream: scimap
options:
  scimap: --csv
- Running outside of MCMICRO: Instructions.
Input
A cell-by-feature table in .csv format, as produced by MCQuant. Nextflow will look for these tables in the quantification/ subdirectory within the project.
Output
- A table of cluster assignments for each cell by the different clustering algorithms implemented within SCIMAP. These tables will be generated in
.csvand.h5adformats. - A set of UMAP plots for the different clustering algorithms, with individual plots written to the
plots/subdirectory in.pdfformat.
Nextflow will write all outputs to the cell-states/scimap/ subdirectory within the project.
Minerva
Interactive viewing and sharing
Description
Minerave allows for fast, interactive viewing of multiplexed images. It also enables highlighting and effective sharing of important regions of interest among collaborators.
Usage
MCMICRO can automatically generate un-annotated Minerva stories if users enable the viz workflow parameter.
Annotated narratives must be manually generated, and users must provide MCMICRO outputs to Minerva in a separate workflow. To learn more about making Minerva stories, visit the Minerva wiki for the most up-to-date information about the Minerva suite.
Other modules
| Name | Purpose | References |
|---|---|---|
| Ilastik | Probability map generator | Code - DOI |
| Cypository | Probability map generator (cytoplasm only) | Code |
| Mesmer | Instance segmentation | Code - DOI |
| Cellpose | Instance segmentation | Code - DOI |
| naivestates | Cell type calling with Naive Bayes | Code |
| FastPG | Clustering (Louvain community detection) | Code - DOI |
| scanpy | Clustering (Leiden community detection) | Code |
| FlowSOM | Clustering (Self-organizing maps) | Code |
| backsub | Autofluorescence correction | Code |
| Imagej-rolling-ball | Background subtraction (rolling ball) | Code |
Ilastik
Description
The module provides a command-line interface to the popular ilastik toolkit and serves as another method for generating probability maps that can be used as an alternative to UnMICST. Check the GitHub for the most up-to-date documentation.
Usage
By default, MCMICRO runs UnMicst for probability map generation. To run Ilastik instead of or in addition to UnMicst, add segmentation: ilastik to workflow parameters. When specifying multiple methods, the method names should be provided as a list enclosed in square brackets. Arguments should be passed to Ilastik via ilastik: in the module options section, while custom models can be provided to Ilastik via ilastik-model: workflow parameter.
- Example
params.yml:
workflow:
  segmentation: [ilastik, unmicst]
  ilastik-model: /full/path/to/mymodel.ilp
options:
  ilastik: --nonzero_fraction 0.5 --num_channels 1
- Default ilastik options:
--num_channels 1 - Running outside of MCMICRO: Instructions.
Input
A stitched and registered .ome.tif, preferably flat field corrected. Nextflow will use as input files from the registration/ subdirectory for whole-slide images and from the dearray/ subdirectory for tissue microarrays.
Output
The output is similar to that produced by UnMicst, namely a .tif stack where the different probability maps for each class are concatenated in the Z-axis in the order: nuclei foreground, nuclei contours, and background. Nextflow will write output to the probability-maps/ilastik/ subdirectory within the project folder.
Optional arguments
| Parameter | Default | Description |
|---|---|---|
--nonzero_fraction <value> | None | Indicates fraction of pixels per crop above global threshold to ensure tissue and not only background is selected |
--nuclei_index <index> | 1 | Index of nuclei channel to use for nonzero_fraction argument |
--num_channels <value> | None | Number of channels to export per image (Ex: 40 corresponds to a 40 channel ome.tif image) |
--channelIDs <indices> | None | Integer indices specifying which channels to export (Ex: 1 2 4). NOTE: You must specify a channel to use for filtering in S3segmenter as –probMapChan in –s3seg-opts |
--ring_mask | Omitted | Specify if you have a ring mask in the same directory to use for reducing size of hdf5 image |
--crop_amount <integer> | None | Number of crops you would like to extract |
Back to Other Modules Back to top
Cypository
Description
Cypository is used to segment the cytoplasm of cells. Check the GitHub repository for the most up-to-date documentation.
Usage
Add segmentation: cypository to workflow parameters to enable Cypository. In general, it would be uncommon to run Cypository alongside probability map generators for nuclei, but it can be done by specifying method names as a list enclosed in square brackets, e.g., segmentation: [cypository, unmicst]. Additional Cypository parameters should be provided to MCMICRO by including a cypository: field in the module options section.
- Example
params.yml:workflow: segmentation: cypository options: cypository: --channel 5 - Default cypository options:
--model zeisscyto
Input
A stitched and registered .ome.tif, preferably flat field corrected. Nextflow will use as input files from the registration/ subdirectory for whole-slide images and from the dearray/ subdirectory for tissue microarrays.
Output
A .tif file that annotates individual pixels with the probability that they belong to the cytoplasm of a cell. Nextflow will write output to the probability-maps/cypository/ subdirectory within the project folder.
Optional arguments
| Parameter | Default | Description |
|---|---|---|
--model | Currently only one model exists (zeisscyto) | |
--channel | channel containing the cytoplasm stain. 0-based indexing. | |
--threshold | 0.6 | A value between 0 and 1 to filter out false detections. |
--overlap | The image is split into overlapping tiles before cytoplasm detection. This parameter specifies the amount of overlap in pixels. | |
--scalingFactor | 1 (no resizing) | Factor by which to increase/decrease image size by. |
--GPU | Default behavior is the first GPU card (0-based indexing). | If multiple GPUs are available, this specifies which GPU card to use. |
Back to Other Modules Back to top
Mesmer
Description
The Mesmer module provides an alternative segmentation approach to UnMicst and ilastik. It is implemented and maintained by an external group. Check their GitHub repository for the most up-to-date information.
Usage
Add segmentation: mesmer to workflow parameters to enable Mesmer. When running together with UnMicst and/or ilastik, method names must be provided as a list enclosed in square brackets. Additional Mesmer parameters can be provided to MCMICRO by including a mesmer: field in the module options section.
For large data sets it is recommended to use the parameters segmentation-recyze: true along with segmentation-channel:. In the example below we consider an image stack of 10 channels with the nuclear marker in channel 2 and membrane marker in channel 7. The use of segmentation-recyze: true will reduce the image stack to these two channels prior to segmentation, hence reindexing the stack channels such that 2–>0 and 7–>1.
- Example
params.yml:
workflow:
  segmentation-channel: 2 7
  segmentation-recyze: true
  segmentation: mesmer
options:
  mesmer: --image-mpp 0.25 --nuclear-channel 0 --membrane-channel 1
- Running outside of MCMICRO: Instructions.
Input
A stitched and registered .ome.tif, preferably flat field corrected. Nextflow will use as input files from the registration/ subdirectory for whole-slide images and from the dearray/ subdirectory for tissue microarrays.
Output
A segmentation mask, similar to the ones produced by S3segmenter. Nextflow will write these files directly to segmentation/.
Optional arguments
| Name | Description | Default Value |
|---|---|---|
--nuclear-channel | The numerical index of the channel(s) from nuclear-image to select. If multiple values are passed, the channels will be summed. | 0 |
--membrane-channel | The position of the membrane channel within the segmentation-channel parameter. | |
--compartment | Predict nuclear or whole-cell segmentation. | "whole-cell" |
--image-mpp | The resolution of the image in microns-per-pixel. A value of 0.5 corresponds to 20x zoom. | 0.5 |
--batch-size | Number of images to predict on per batch. | 4 |
Back to Other Modules Back to top
Cellpose
Description
Cellpose is a DL segmentation algorithm able to segment the nuclear or cytoplasmic compartments of the cell. Publications of this algorithm can be found in 1 and 2. A thorough documentation of the script and CLI can be found here.
Usage
To use this segmentation method add the line segmentation: cellpose in the workflow section of the params.yml file. Under the options section of params.yml specify the input arguments of the cellpose script, such as segmentation model and channel(s) on which the model will be applied. Notice that the channel(s) argument(s), i.e. –chan and –chan2, expect a zero-based index.
For large data sets it is recommended to use the parameters segmentation-recyze: true along with segmentation-channel:. In the example below we consider an image stack of 10 channels with the nuclear marker in channel 2 and membrane marker in channel 7. The use of segmentation-recyze: true will reduce the image stack to these two channels prior to segmentation, hence reindexing the stack channels such that 2–>0 and 7–>1.
- Example
params.yml:
workflow:
  segmentation-channel: 2 7
  segmentation-recyze: true
  segmentation: cellpose
options:
  cellpose: --pretrained_model cyto --chan 1 --chan2 0 --no_npy
- Running outside of MCMICRO: Github, Instructions.
Input
- The image (
.tif) to be segmented should be in theregistration/subdirectory. - –pretained_model: name of the built-in model to be used for segmentation, options include “nuclei”,“cyto” and “cyto2”. Alternatively you can give a file path to a custom retrained model. Custom models can be trained in the cellpose GUI.
- –chan: zero-based index of the channel on which the segmentation model will be applied. When using the “nuclei” model provide the index of the nuclear channel, e.g. DAPI. In the case of the “cyto” models provide the channel of the membrane marker.
- –chan2 [optional]: index of the nuclear marker channel. This argument is valid only when using the “cyto” models.
Output
A .tif image with the segmentation masks in the segmentation/ subdirectory.
Optional arguments
| Name | Description | Default Value |
|---|---|---|
--pretrained_model | Name of a built-in segmentation model or a file path to a custom model. | cyto |
--chan | Index of the selected channel to segment. | 0 |
--chan2 | Index of the nuclear marker channel. | 0 |
--no_npy | Boolean flag to suppress saving the .npy files output (recommended to avoid overflow errors when processing large data sets). | False |
Clustering
Description
MCMICRO integrates three methods for clustering single-cell data. These are FastPG (Fast C++ implementation of the popular Phenograph method), Leiden community detection via scanpy, and FlowSOM.
Usage
Add a downstream: field to workflow parameters to select one or more methods. Method names should be provided as a comma-delimited list enclosed in square brackets. Additional method parameters should be provided to MCMICRO by adding fastpg:, scanpy: and flowsom: fields to the module options section.
- Example
params.yml:
workflow:
  stop-at: downstream
  downstream: [fastpg, flowsom, scanpy]
options:
  fastpg: -k 10
  scanpy: -k 10
- Running outside of MCMICRO:
Input
All methods accept as input the cell-by-feature matrix in .csv format. Nextflow looks for these files in the quantification/ subfolder within the project directory.
Output
All methods output a .csv file annotating individual cells with their cluster index. Nextflow will write these files to the cell-states/ subfolder within the project directory.
Optional arguments to FastPG
| Parameter | Default | Description |
|---|---|---|
-v, --verbose | Flag to print out progress of script | |
-k NEIGHBORS | 30 | The number of nearest neighbors to use when clustering. |
-n NUM_THREADS | 1 | The number of cpus to use during the k nearest neighbors part of clustering. |
-c, --method | Include a column with the method name in the output files. | |
--force-transform | Log transform the input data. If omitted, and –no– transform is omitted, log transform is only performed if the max value in the input data is >1000. | |
--no-transform | Do not perform Log transformation on the input data. If omitted, and –force-transform is omitted, log transform is only performed if the max value in the input data is >1000. |
Optional arguments to scapy
| Parameter | Default | Description |
|---|---|---|
-v, --verbose | Flag to print out progress of script | |
-k NEIGHBORS | 30 | The number of nearest neighbors to use when clustering. |
-c, --method | Include a column with the method name in the output files. | |
--force-transform | Log transform the input data. If omitted, and –no– transform is omitted, log transform is only performed if the max value in the input data is >1000. | |
--no-transform | Do not perform Log transformation on the input data. If omitted, and –force-transform is omitted, log transform is only performed if the max value in the input data is >1000. |
Optional arguments to FlowSOM
| Parameter | Default | Description |
|---|---|---|
-v, --verbose | Flag to print out progress of script | |
-c, --method | Include a column with the method name in the output files. | |
-n, --num-metaclusters | 25 | The number of clusters for meta-clustering. |
--xdim XDIM | 10 | The number of neurons in the SOM in the x dimension. |
--ydim YDIM | 10 | The number of neurons in the SOM in the y dimension. |
--force-transform | Log transform the input data. If omitted, and –no– transform is omitted, log transform is only performed if the max value in the input data is >1000. | |
--no-transform | Do not perform Log transformation on the input data. If omitted, and –force-transform is omitted, log transform is only performed if the max value in the input data is >1000. |
Back to Other Modules Back to top
Naivestates
Description
naivestates is a label-free, cluster-free tool for inferring cell types from quantified marker expression data, based on known marker <-> cell type associations. Check the GitHub repository for the most up-to-date documentation.
Usage
Add a downstream: field to workflow parameters to select naivestates. When running alongside other cell state inference methods, such as SCIMAP, method names should be provided as a list enclosed in square brackets. Custom marker to cell type (mct) mapping can be provided to naivestates via the naivestates-model: workflow parameters, while additional arguments should be specified by including a naivestates: field in the module options section.
- Example
params.yml:
workflow:
  stop-at: downstream
  downstream: naivestates
  naivestates-model: /full/path/to/mct.csv
options:
  naivestates: --log no
- Default naivestates options:
-p png - Running outside of MCMICRO: Instructions.
Inputs
- A cell-by-feature table in
.csvformat, such as one produced by MCquant. Nextflow will look for such tables in thequantification/subfolder of the project directory. - [Optional] A two-column
.csvfile providing a many-to-many mapping between markers and cell types/states. The columns must be namedMarkerandState.
Outputs
- A
.csvfile providing probabilities that a marker is expressed for each cell-marker pair. - If the mapping to cell types is provided, a second
.csvfile with probabilistic annotations of each cell with its type/state. - A set of plots showing probability distributions and UMAP projections
Nextflow will write all outputs to the cell-states/naivestates/ subdirectory within the project. If relevant, additional QC files will be written to qc/naivestates.
Optional arguments
| Parameter | Default | Description |
|---|---|---|
--plots <off|pdf|png> | off | Produces QC plots of individual marker fits and summary UMAP plots in .png or .pdf format. |
--id <name> | CellID | Name of the column that contains cell IDs |
--log <yes|no|auto> | auto | When a log10 transformation should be applied prior to fitting the data. The tool will do this automatically if it detects large values. Use --log no to force the use of original, non-transformed values instead. |
--comb <hmean|gmean> | gmean | Whether to use harmonic mean (hmean) or geometric mean (gmean) to combine probabilities of expression for individual markers. |
--sfx <suffix> | automatically determined | A common suffix on the marker columns (e.g., _cellMask or _nucleiMask). The suffix will be removed in the output plots and tables to improve readability. Use $ to force an empty suffix. |
--umap | disabled | Include this flag to generate UMAP plots. |
--mct <filename> | The tool has a basic marker -> cell type (mct) mapping in typemap.csv. More sophisticated mct mappings can be defined by creating a custom-map.csv file with two columns: Marker and State. |
Back to Other Modules Back to top
Backsub
Description
Backsub is an autofluorescence subtraction module for sequential IF images. It performs pixel-level subtraction on large .ome.tif images primarily developed with the Lunaphore COMET platform outputs in mind.
Usage
By default, MCMICRO assumes background subtraction should not be performed. Add background: true to module options to indicate it should be. By default, the background-method parameter is set to backsub. If channels are removed using this module, and segmentation-channel is specified, it should be kept in mind that the index provided with segmentation-channel would refer to the index after channel removal.
- Example
params.yml:
workflow:
  background: true
  background-method: backsub
- Running outside of MCMICRO: Instructions.
Inputs
- Stitched and registered multi-cycle
.ome.tif - The
markers.csvfile must contain amarker_namecolumn specifying channel markers. Thebackgroundcolumn indicates which channel should be subtracted and the value must match the marker name of the background channel. Theexposurecolumn with exposure times for respective channel acquisitions is also required. Additionally, theremovecolumn can have “TRUE” values for channels which shouldn’t be included in the output. An examplemarkers.csvcan be found here.
Outputs
- A pyramidal, tiled
.ome.tif. Nextflow will write the output file tobackground/within the project directory. By default, the output is compressed. - A modified
markers.csvto match the background subtracted image.
Optional arguments
| Parameter | Default | Description |
|---|---|---|
--pixel-size | None | The resolution of the image in microns-per-pixel. If not provided, it is read from metadata. If that is not possible, 1 is assigned. |
--tile-size | 256 | Tile size used for pyramid image generation. |
--compression | zlib | The output pyramidal OME-TIFF will be compressed using the specified compression. Set to “none” for no compression. “lzw”, “zlib”, or “none” are accepted options. |
Back to Other Modules Back to top
Imagej-rolling-ball
Description
Imagej-rolling-ball is a background subtraction module that applies ImageJ’s “Subtract Background…” function to the multi-channel whole-slide images. Application of rolling ball background subtraction for widefield fluorescent microscopy is demonstrated here
Usage
By default, MCMICRO does not perform background subtraction. Add background: true and background-method: imagej-rolling-ball to module options to run it.
Note that as mentioned here, the radius of the rolling ball “should be at least as large as the radius of the largest object in the image that is not part of the background”. The default radius is 100 pixels as below (imagej-rolling-ball: 100 -n=4 -j="-Xmx4g"). We generally use 100 for images with resolution of 0.325 µm/pixel.
- Example
params.yml:
workflow:
  background: true
  background-method: imagej-rolling-ball

options:
  imagej-rolling-ball: 100 -n=4 -j="-Xmx4g"
- Running outside of MCMICRO: Instructions.
Inputs
- Stitched and registered multi-cycle
.ome.tif
Outputs
- A pyramidal, tiled
{input-image-name}-ij_rolling_ball_{radius}.ome.tif. Nextflow will write the output file tobackground/within the project directory.
Back to Other Modules Back to top
Suggest a module
Module suggestions can be made by posting to https://forum.image.sc/ and tagging your post with the mcmicro tag.